Fig. 1
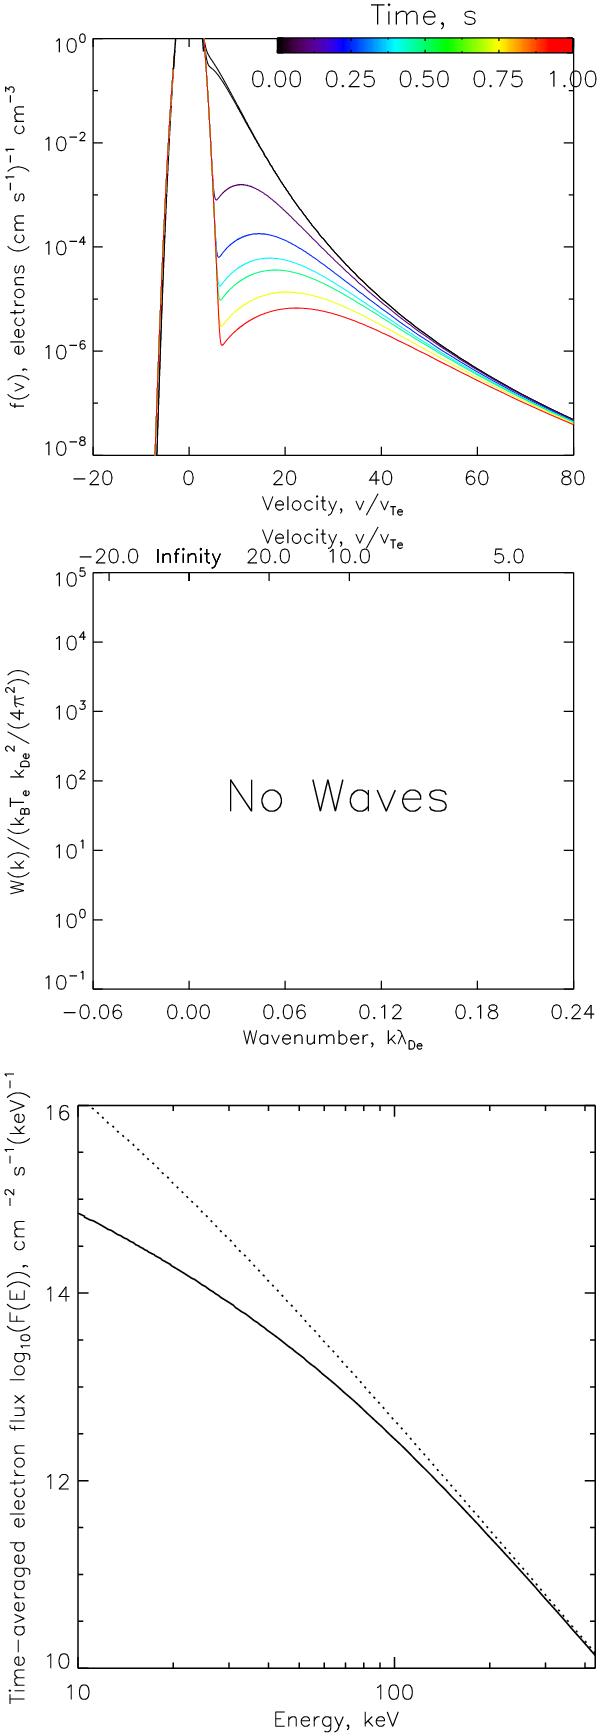
Collisional relaxation of an electron beam in a plasma. Top and middle panels: the electron distribution function f(v) and the spectral energy density of Langmuir waves (here fixed at the thermal level), respectively. Each coloured line shows the distribution at a different time. Bottom panel: the time-averaged electron flux spectrum [electrons keV-1 cm-2 s-1] plotted against electron energy. The dashed line shows the initial power-law flux.
Current usage metrics show cumulative count of Article Views (full-text article views including HTML views, PDF and ePub downloads, according to the available data) and Abstracts Views on Vision4Press platform.
Data correspond to usage on the plateform after 2015. The current usage metrics is available 48-96 hours after online publication and is updated daily on week days.
Initial download of the metrics may take a while.