Fig. 6
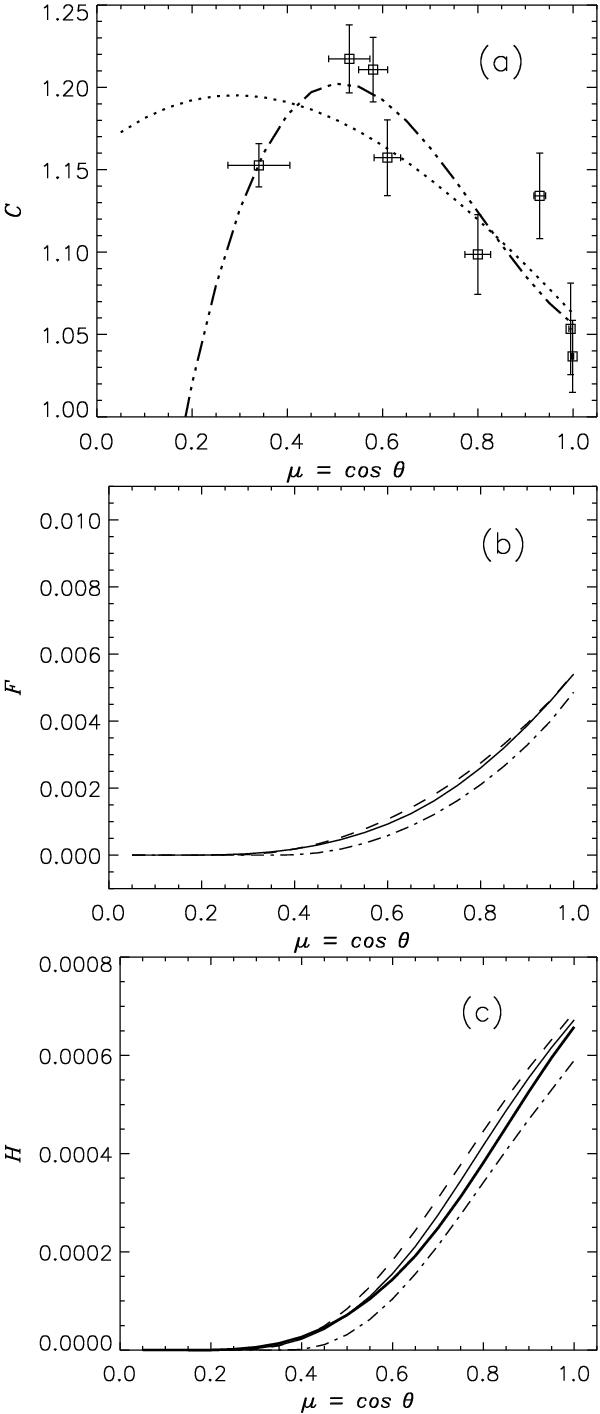
a) Contrast of the BPs in the G-band as observed in our fields, C. The different smooth fits to the observed CLV. b) Fraction of total solar disk covered by BPs from the solar limb to a particular μ – F in Eq. (4). The three different types of line correspond to the three curves in Fig. 2. c) Fraction of TSI contributed by the quiet Sun BPs – H in Eq. (5). The three different types of thin lines correspond to the three curves in Fig. 2, with the contrast given by the triple-dot dashed line in a). The thick solid line is equivalent to the thin solid line except that the contrast is taken as the dotted line in a).
Current usage metrics show cumulative count of Article Views (full-text article views including HTML views, PDF and ePub downloads, according to the available data) and Abstracts Views on Vision4Press platform.
Data correspond to usage on the plateform after 2015. The current usage metrics is available 48-96 hours after online publication and is updated daily on week days.
Initial download of the metrics may take a while.