Fig. 3
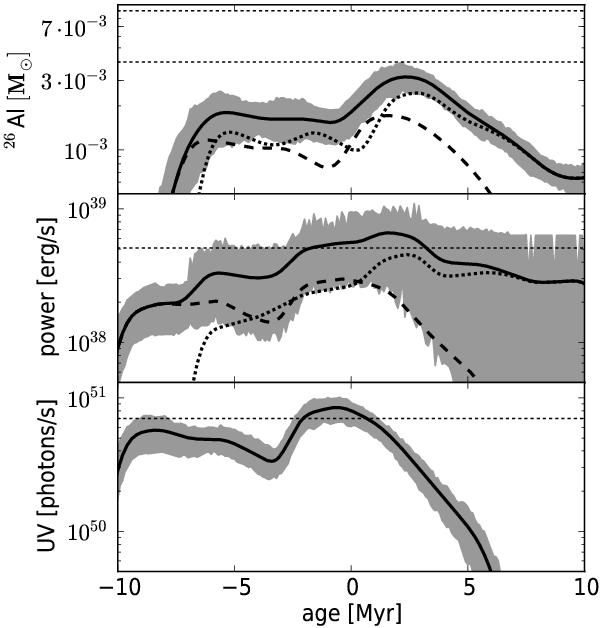
Population synthesis model of the Carina region, for a combined population of stars from all the stellar clusters with the ages given in Table 1 and numbers of stars given in Table 3. Time zero corresponds to the current time. The upper panel shows the mass of 26Al in the ISM of the Carina region, the middle panel shows the mechanical power ejected into the ISM from the massive stars, and the lower panel shows the emitted flux of hydrogen ionizing photons (>13.6 eV). The solid lines show the total output from the stellar population, the dashed line shows the output from the winds, and the dotted line shows the output from supernova explosions. The grey shaded areas show the 1σ deviations of the total output caused by random sampling of the IMF. The horizontal dashed lines indicate estimates based on observations, as discussed in the population synthesis part of Sect. 4.
Current usage metrics show cumulative count of Article Views (full-text article views including HTML views, PDF and ePub downloads, according to the available data) and Abstracts Views on Vision4Press platform.
Data correspond to usage on the plateform after 2015. The current usage metrics is available 48-96 hours after online publication and is updated daily on week days.
Initial download of the metrics may take a while.