Fig. 10
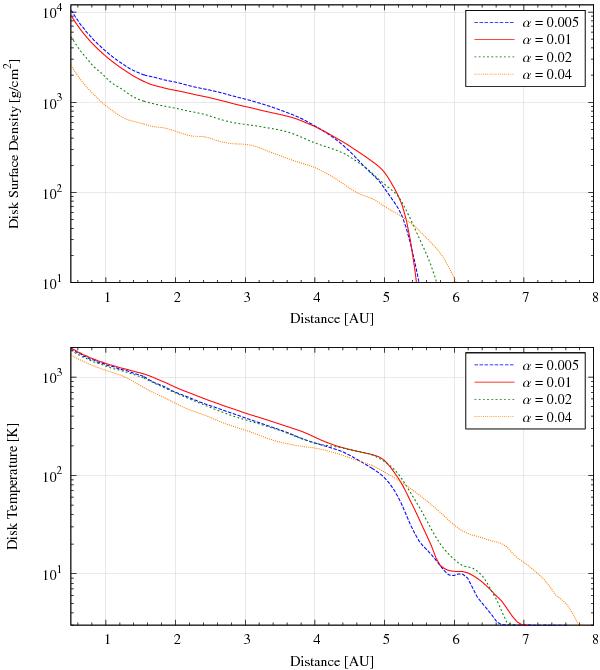
Azimuthally averaged surface density (top) and midplane temperature (bottom) profiles after 100 binary orbits (6666 years) using four different values for the viscosity parameter α. The profiles can be fitted using power-laws when divided into two regimes: An inner region with temperatures of less than about 1000 K and an outer region with temperatures above 1000 K, because there is a break in the opacity tables at about 1000 K. The inner region follows Σ ∝ r − 1.48 to −1.53 and T ∝ r-0.53, whereas the outer region follows Σ ∝ r − 0.78 to −0.95 and T ∝ r − 1.45 to −1.53 for all α values.
Current usage metrics show cumulative count of Article Views (full-text article views including HTML views, PDF and ePub downloads, according to the available data) and Abstracts Views on Vision4Press platform.
Data correspond to usage on the plateform after 2015. The current usage metrics is available 48-96 hours after online publication and is updated daily on week days.
Initial download of the metrics may take a while.