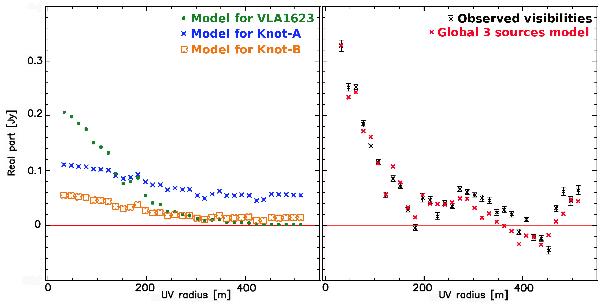
Fig. 2

The left panel shows, for the three continuum sources, the best-fit model profiles of the visibilities’ real parts as a function of projected baseline length. The visibilities for the continuum source modeled at the position of VLA1623 are shown as green dots, the model visibilities towards Knot-A as blue crosses, and the model visibilities reproducing the source at the position of Knot-B are shown as open orange squares. The right panel shows the observed profile of the visibilities real parts in our SMA continuum data (plotted as black points with 3σ error bars) centered at the position of VLA1623, and the global best-fit model (red crosses) featuring the three gaussian sources shown in the left panel, centered at the same position. The properties of the three continuum sources deduced from this best-fit model are reported in Table 1.
Current usage metrics show cumulative count of Article Views (full-text article views including HTML views, PDF and ePub downloads, according to the available data) and Abstracts Views on Vision4Press platform.
Data correspond to usage on the plateform after 2015. The current usage metrics is available 48-96 hours after online publication and is updated daily on week days.
Initial download of the metrics may take a while.


