Fig. 1
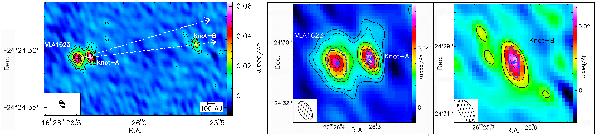
Left panel: wide-field SMA 1.3-mm continuum map towards VLA1623. In this map the beam size is 0.7″ × 0.4″, allowing the three components detected at the positions of VLA1623, Knot-A and Knot-B to be disentangled. The rms noise in the continuum map is 2.1 mJy/beam. Black contours are levels of 6.3 mJy/beam (3σ-level, dashed contour), then 5σ to 20σ levels by 5σ, and ultimately 30σ and 40σ levels. The two white arrows represent the opening angle (~30°) of the protostellar outflow according to CO low-resolution observations and knots of shocked H2 emission (André et al. 1990; Dent et al. 1995). Right panel: blow-ups of the 1.3-mm continuum map towards the three detected sources. The positions (blue stars) and FWHMs (dashed ellipses) of the deconvolved sources modeled (see Table 1) are shown.
Current usage metrics show cumulative count of Article Views (full-text article views including HTML views, PDF and ePub downloads, according to the available data) and Abstracts Views on Vision4Press platform.
Data correspond to usage on the plateform after 2015. The current usage metrics is available 48-96 hours after online publication and is updated daily on week days.
Initial download of the metrics may take a while.