Fig. 8
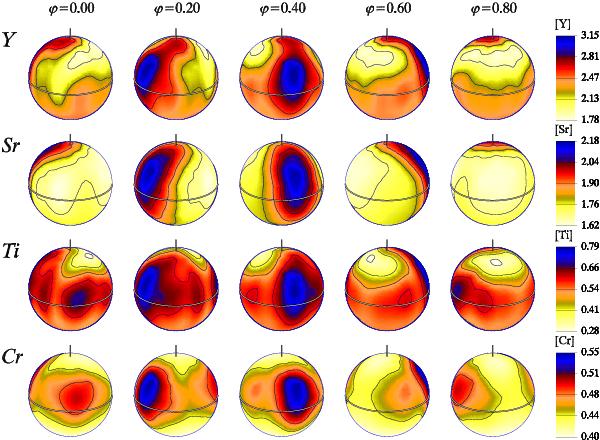
Surface maps of Y, Sr, Ti, and Cr derived for ϕ Phe. The star is shown at four equidistant rotational phases with rotational axis oriented vertically. Inclination of the rotational axis is 65°. The abundance scale relative to the Sun is plotted on the right. Darker regions correspond to a higher relative abundance. The contours for Y plotted with a step of 0.33 dex, 0.13 dex for Sr and Ti, and 0.04 dex for Cr.
Current usage metrics show cumulative count of Article Views (full-text article views including HTML views, PDF and ePub downloads, according to the available data) and Abstracts Views on Vision4Press platform.
Data correspond to usage on the plateform after 2015. The current usage metrics is available 48-96 hours after online publication and is updated daily on week days.
Initial download of the metrics may take a while.