Free Access
Fig. 15
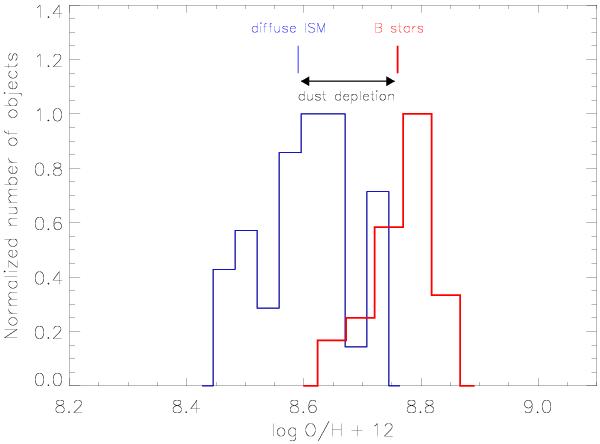
Comparison of the stellar O abundance distribution as derived in the present work (red histogram) with gas-phase abundances along different sightlines of the diffuse ISM (thin blue histogram, Cartledge et al. 2004), in analogy to Fig. 12. Mean abundances are indicated.
Current usage metrics show cumulative count of Article Views (full-text article views including HTML views, PDF and ePub downloads, according to the available data) and Abstracts Views on Vision4Press platform.
Data correspond to usage on the plateform after 2015. The current usage metrics is available 48-96 hours after online publication and is updated daily on week days.
Initial download of the metrics may take a while.