Fig. 14
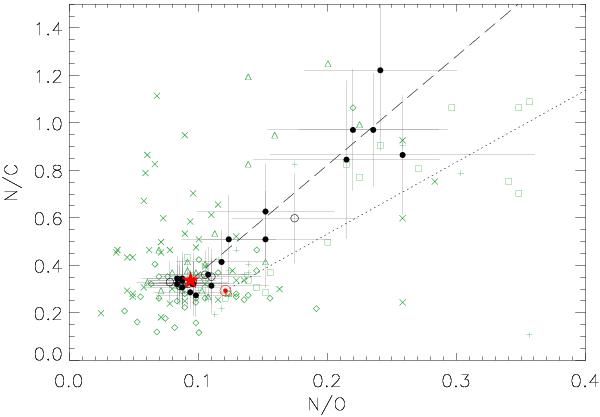
Observational constraints on mixing of CNO-burning products in massive stars. Mass ratios N/C over N/O are displayed. Black dots: present data; black circles: 9 additional objects from NS11. Data from previous non-LTE analyses are given as grey symbols (green online) – plus signs: Kilian (1992); triangles: Gies & Lambert (1992); diamonds: Cunha & Lambert (1994), Daflon et al. (1999, 2001a,b); squares: Morel et al. (2008); crosses: Hunter et al. (2009). The predicted nuclear paths assuming initial CAS abundances (red star) and solar abundances ( ⊙ ) of Asplund et al. (2009) are indicated by the long-dashed and dotted lines, respectively. Statistical uncertainties of 0.2 dex in each element – which are typical for previous literature data – result in an error bars more than twice as large than those from the present data.
Current usage metrics show cumulative count of Article Views (full-text article views including HTML views, PDF and ePub downloads, according to the available data) and Abstracts Views on Vision4Press platform.
Data correspond to usage on the plateform after 2015. The current usage metrics is available 48-96 hours after online publication and is updated daily on week days.
Initial download of the metrics may take a while.