Fig. 7
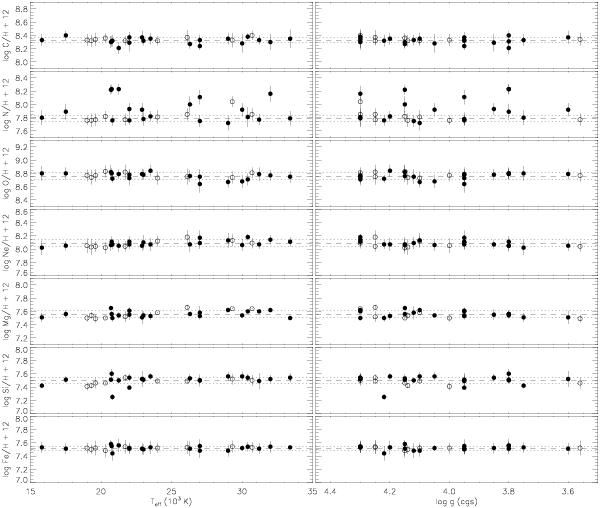
Metal abundances as a function of effective temperature (left) and of surface gravity (right). Sample stars from the present work are indicated by dots, data from NS11 by open circles. Error bars are statistical 1σ-uncertainties. Average abundances from the combined samples are indicated by the dashed line, the dotted lines delineate the 1σ-scatter around the average value. See Sect. 5.2 for a discussion.
Current usage metrics show cumulative count of Article Views (full-text article views including HTML views, PDF and ePub downloads, according to the available data) and Abstracts Views on Vision4Press platform.
Data correspond to usage on the plateform after 2015. The current usage metrics is available 48-96 hours after online publication and is updated daily on week days.
Initial download of the metrics may take a while.