Fig. 4
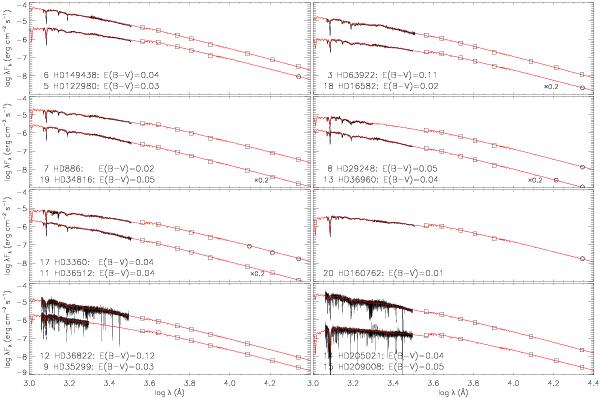
Comparison between synthetic fluxes based on Teff and log g values from multiple ionization equilibria to observed spectral energy distributions for the sample stars with available IUE data. Displayed are wavelength-weighted fluxes λFλ from the far-UV to the near-IR in the K-band. Observations consist of IUE spectra (black lines), Johnson UBVRIJHK photometry (boxes) and 2MASS JHK photometry (circles). Model fluxes are indicated by red lines. The observations have been dereddened adopting colour excesses as indicated and the model fluxes have been normalised with respect to the observations in V. Some fluxes have been scaled for clarity, as indicated.
Current usage metrics show cumulative count of Article Views (full-text article views including HTML views, PDF and ePub downloads, according to the available data) and Abstracts Views on Vision4Press platform.
Data correspond to usage on the plateform after 2015. The current usage metrics is available 48-96 hours after online publication and is updated daily on week days.
Initial download of the metrics may take a while.