Fig. 16
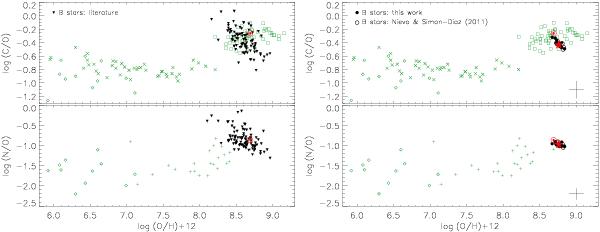
Observational constraints on the chemical evolution of Galactic CNO abundances: abundance ratios log (C/O) and log (N/O) vs. O abundance. Left panels: black triangles: early B-stars from the literature extracted from Fig. 12. Data for low-mass stars are displayed as grey symbols (green in the online edition) – squares: Gustafsson et al. (1999, solar-type dwarfs); crosses: Fabbian et al. (2009, solar-type dwarfs and subgiants); diamonds: Spite et al. (2005, unmixed cool giants); plus signs: Israelian et al. (2004, unevolved solar-type stars). Solar abundance ratios of Asplund et al. (2009) are also indicated ( ⊙ ). Right panels: black dots: unmixed objects from the present work, black circles: unmixed stars from NS11. Data from the literature like in the left panels. The CAS is also indicated (red star). Error bars (statistical 1σ-uncertainties) typical for individual stars in the present study are shown.
Current usage metrics show cumulative count of Article Views (full-text article views including HTML views, PDF and ePub downloads, according to the available data) and Abstracts Views on Vision4Press platform.
Data correspond to usage on the plateform after 2015. The current usage metrics is available 48-96 hours after online publication and is updated daily on week days.
Initial download of the metrics may take a while.