Free Access
Fig. 7
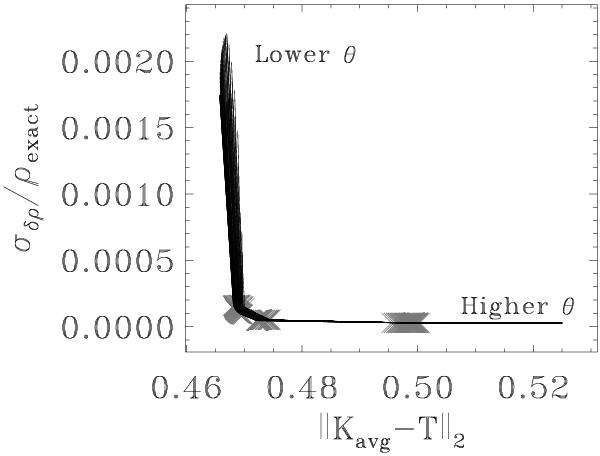
Superimposed trade-off curves for each of the 93 models from the grid. The parameters are Msurf = 0, β = 10-8 and θ = 10-6, 10-4, 10-2, 1, 1.5. The grey “ × ” marks the locations of intermediate θ values.
Current usage metrics show cumulative count of Article Views (full-text article views including HTML views, PDF and ePub downloads, according to the available data) and Abstracts Views on Vision4Press platform.
Data correspond to usage on the plateform after 2015. The current usage metrics is available 48-96 hours after online publication and is updated daily on week days.
Initial download of the metrics may take a while.