Fig. 6
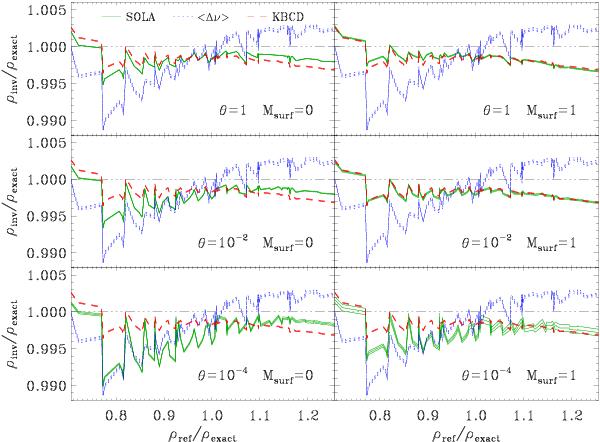
Inversion results for Model A, using the modes with n = 15−25 and ℓ = 0−2. The x axis gives the mean density of the reference models divided by that of Model A, while the y axis is the mean densities obtained from the various inversion procedures, normalised by that of Model A. For each procedure, there are three lines corresponding to the result and the 1σ error bar around it. The horizontal triple-dot-dashed line shows the correct mean density. A ν−b + 1Qnℓ normalisation has been used when surface corrections are included in SOLA inversions.
Current usage metrics show cumulative count of Article Views (full-text article views including HTML views, PDF and ePub downloads, according to the available data) and Abstracts Views on Vision4Press platform.
Data correspond to usage on the plateform after 2015. The current usage metrics is available 48-96 hours after online publication and is updated daily on week days.
Initial download of the metrics may take a while.