Free Access
Fig. 5
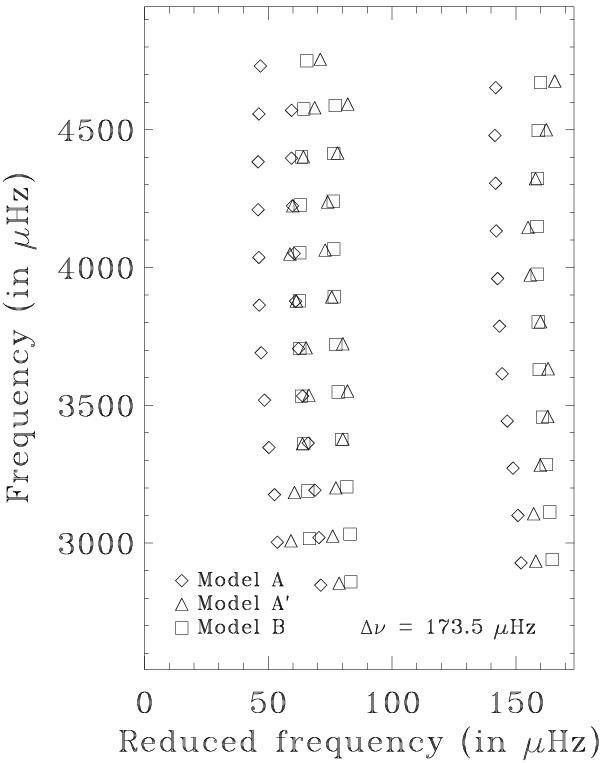
Echelle diagram with the frequencies from Models A, A′ and B. The ℓ = 2 and ℓ = 0 ridges are to the left, while the ℓ = 1 ridge is to the right. Note: the large frequency separation indicated in the lower right corner is the value used to construct this figure, not necessarily the exact value for the three models.
Current usage metrics show cumulative count of Article Views (full-text article views including HTML views, PDF and ePub downloads, according to the available data) and Abstracts Views on Vision4Press platform.
Data correspond to usage on the plateform after 2015. The current usage metrics is available 48-96 hours after online publication and is updated daily on week days.
Initial download of the metrics may take a while.