Fig. 3
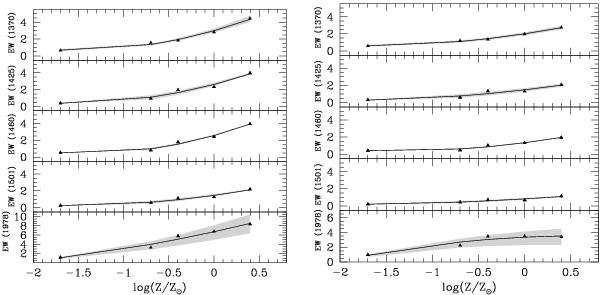
EW-Z relations for the five indices considered. The triangles represent equivalent widths measured from the reference models at age 50 Myr, while the solid line is the quadratic fit given by equations in Table 2 for the real continuum (left panels) and Table 3 for the “pseudo-continuum” (right panels). The grey region represents the error caused by the dependence of the models on the IMF assumed.
Current usage metrics show cumulative count of Article Views (full-text article views including HTML views, PDF and ePub downloads, according to the available data) and Abstracts Views on Vision4Press platform.
Data correspond to usage on the plateform after 2015. The current usage metrics is available 48-96 hours after online publication and is updated daily on week days.
Initial download of the metrics may take a while.