Free Access
Fig. 7
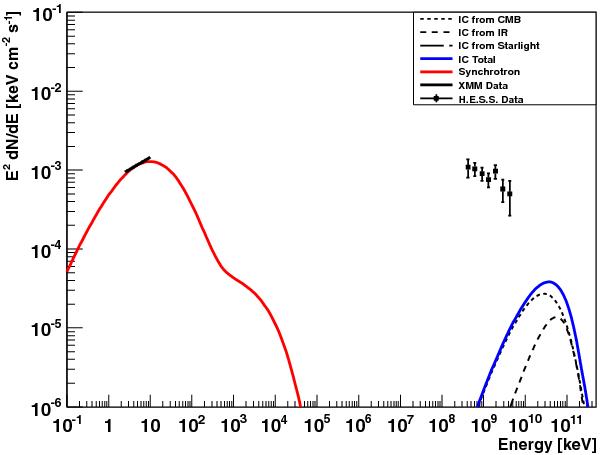
Modeled spectral energy distribution of G0.9 + 0.1 showing the synchrotron and IC emission of the inner 30″ for Scenario II. Also included are the measured XMM-Newton data of the modeled area, as well as the H.E.S.S. data of the whole source (Aharonian et al. 2005).
Current usage metrics show cumulative count of Article Views (full-text article views including HTML views, PDF and ePub downloads, according to the available data) and Abstracts Views on Vision4Press platform.
Data correspond to usage on the plateform after 2015. The current usage metrics is available 48-96 hours after online publication and is updated daily on week days.
Initial download of the metrics may take a while.