Fig. 8
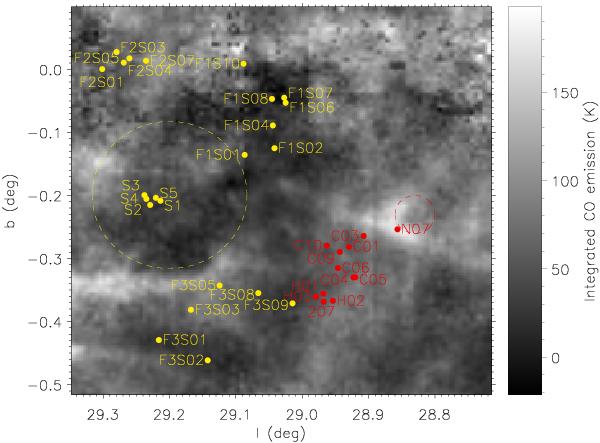
Spatial distribution of the sources from this work (red dots) and N11 (yellow dots), plotted over the CO emission (integrated in the range 0 < vLSR < 130 km s-1, the tangent point along the line of sight) taken from the Galactic Ring Survey (Jackson et al. 2006). The yellow dashed circle represents the position of RSGC3 (assuming a radius for the cluster of 7′), and the red dashed circle follows the almost circular shell of the HII region N49 (Watson et al. 2008).
Current usage metrics show cumulative count of Article Views (full-text article views including HTML views, PDF and ePub downloads, according to the available data) and Abstracts Views on Vision4Press platform.
Data correspond to usage on the plateform after 2015. The current usage metrics is available 48-96 hours after online publication and is updated daily on week days.
Initial download of the metrics may take a while.