Fig. 7
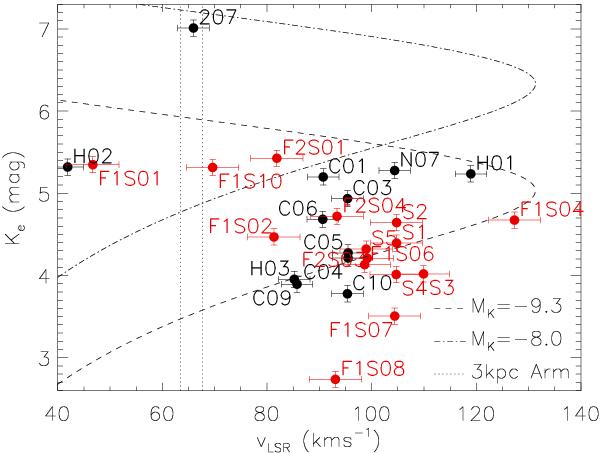
vLSR versus extinction-corrected magnitude Ke for the observed supergiants. Black dots denote the measurements derived in this work, while red dots are used for those taken from N11. The dashed and dot-dashed lines represent the locus that a supergiant population with mean MK = −9.3 (that corresponds to the bulk of RSGC3) and MK = −8.0 (all RSGs are expected to be brighter than this limit, Wood et al. 1983) would occupy assuming the rotation curve from Reid et al. (2009). This work uses Θ0 = 254 kms-1 and R0 = 8.4 kpc. The dotted lines mark the expected velocities of the 3 kpc arm at l = 28° and l = 29°, according to Dame & Thaddeus (2008).
Current usage metrics show cumulative count of Article Views (full-text article views including HTML views, PDF and ePub downloads, according to the available data) and Abstracts Views on Vision4Press platform.
Data correspond to usage on the plateform after 2015. The current usage metrics is available 48-96 hours after online publication and is updated daily on week days.
Initial download of the metrics may take a while.