Fig. 5
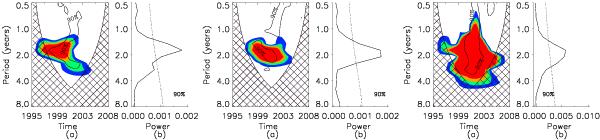
a) The local wavelet power spectrum for ℓ = 0, 1, 2. White represent areas of little power, red those with the largest power. Solid rings identify areas at power of 0.001, 0.002, 0.005 over time, and only those that achieved 90% confidence level are labeled. b) Global wavelet power spectrum. The dotted line are the 90% of confidence level.
Current usage metrics show cumulative count of Article Views (full-text article views including HTML views, PDF and ePub downloads, according to the available data) and Abstracts Views on Vision4Press platform.
Data correspond to usage on the plateform after 2015. The current usage metrics is available 48-96 hours after online publication and is updated daily on week days.
Initial download of the metrics may take a while.