Fig. 9
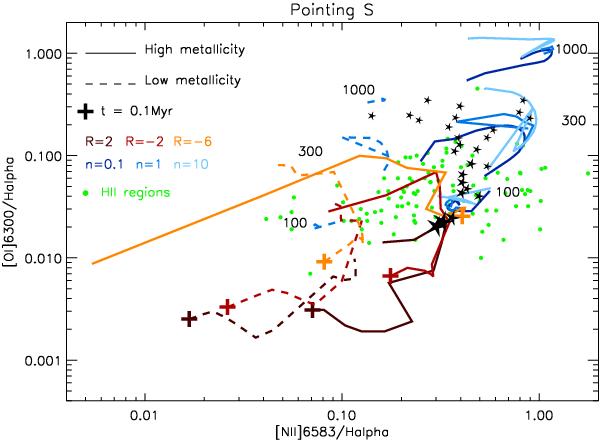
[Nii]λ6583 Å/Hα vs. [Oi]λ6300 Å/Hα for the spaxels of pointing S. Black stars and dots correspond to components A and B, respectively. The size of the dots is proportional to the flux of the Hα line. Only components for which the intensity peaks of the lines [Oi]λ6300 Å and [Nii]λ6583 Å are above Σbkg are plotted. The brown lines correspond to the star formation models from Dopita et al. (2006) (solid lines for solar metallicity and dashed lines for 0.4 solar metallicity). Each line corresponds to a temporal sequence where the beginning is indicated with a “ + ” and corresponds to an age of t = 0.1 Myr, and the opposite tip of the line corresponds to an age of t = 6 Myr. The values of the parameter R are color-coded as indicated in the legend. The blue lines correspond to the shock + precursor models of Allen et al. (2008) (solid lines for solar metallicity and dashed lines for SMC metallicity). The values of the pre-shock density are color-coded and indicated in the legend in units of cm-3. For SMC metallicity only models with ne = 1 cm-3 are plotted. The numbers close to the shock models indicate the shock velocity in km s-1. Small green dots correspond to the samples of Hii regions from van Zee et al. (1998) and van Zee & Haynes (2006).
Current usage metrics show cumulative count of Article Views (full-text article views including HTML views, PDF and ePub downloads, according to the available data) and Abstracts Views on Vision4Press platform.
Data correspond to usage on the plateform after 2015. The current usage metrics is available 48-96 hours after online publication and is updated daily on week days.
Initial download of the metrics may take a while.