Fig. 5
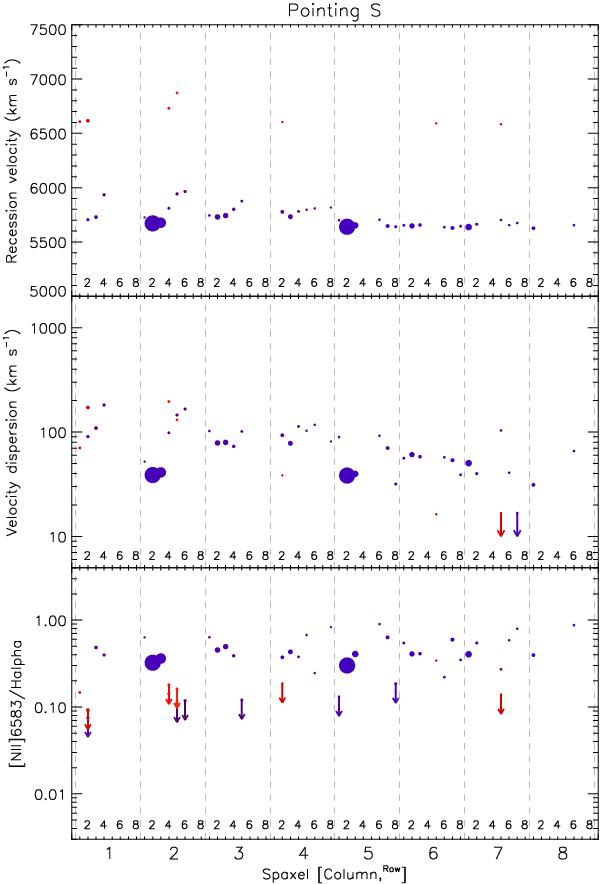
Recession velocity (top), velocity dispersion (middle) and [Nii]λ6583 Å/Hα flux ratio (bottom) for the spectra of pointing S. Arrows correspond to upper limits in [Nii]λ6583Å/Hα and σ. Only components for which the intensity peak of the Hα line is above 5Σbkg are plotted. The major and minor ticks of the X-axis correspond to the column and the row of each spaxel, respectively, as is illustrated in Figs. 2 to 4. For each spectrum, each component is represented for a filled dot. In the three panels, the color of the dots is related to the recession velocity of the component, where bluer corresponds to lower velocity, and redder corresponds to higher velocity, and the size of each dot is proportional to the flux of the Hα line of the corresponding component.
Current usage metrics show cumulative count of Article Views (full-text article views including HTML views, PDF and ePub downloads, according to the available data) and Abstracts Views on Vision4Press platform.
Data correspond to usage on the plateform after 2015. The current usage metrics is available 48-96 hours after online publication and is updated daily on week days.
Initial download of the metrics may take a while.