Fig. 2
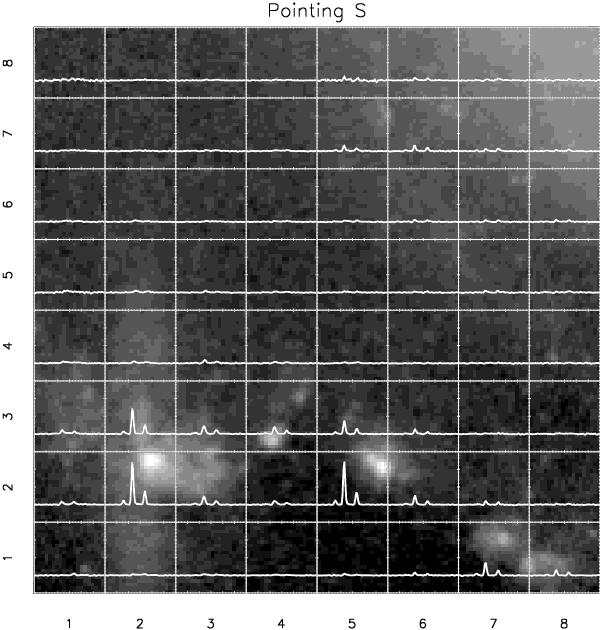
Spatial arrangement of the spectra of pointing S after a 2 × 2 binning of the spaxels overlaid on the HST V-band image. The X-axis of all spectra ranges from 6650 Å to 6750 Å. The Y-axis scale is the same for all spectra and ranges from − 1.53 × 10⁻¹⁷ to 1.53 × 10⁻¹⁶ erg s-1 cm-2 Å-1. Each spectrum is univocally identified by two numbers indicating the row and column occupied in the two-dimensional array. The orientation of the array is such that North is up and East is left.
Current usage metrics show cumulative count of Article Views (full-text article views including HTML views, PDF and ePub downloads, according to the available data) and Abstracts Views on Vision4Press platform.
Data correspond to usage on the plateform after 2015. The current usage metrics is available 48-96 hours after online publication and is updated daily on week days.
Initial download of the metrics may take a while.