Free Access
Fig. 17
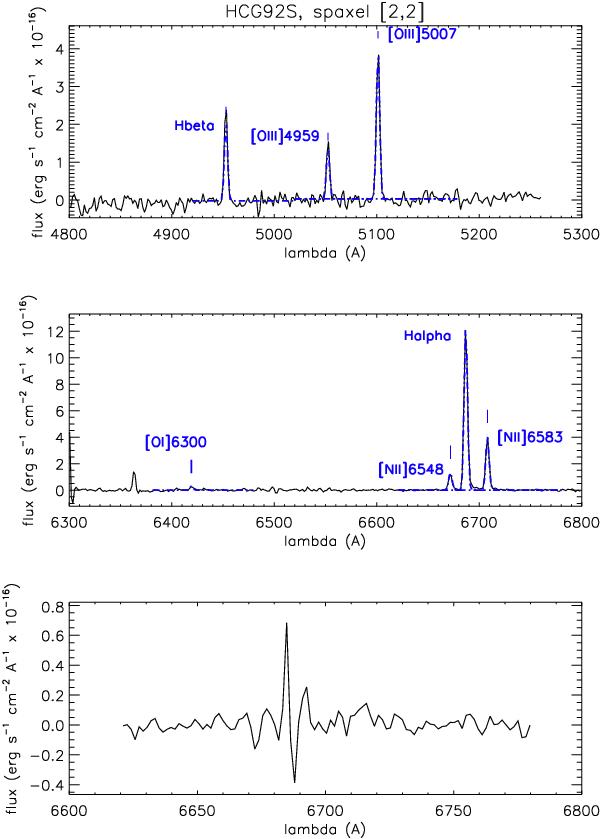
Top: blue spectrum of spaxel S[2, 2]. Middle: red spectrum of spaxel S[2,2]. Bottom: residuals of the best-fit to the spectrum of spaxel S[2, 2] in the red wavelength range. The best-fits to the emission lines of components A and B for which the intensity peak is above Σbkg are shown in blue and red, respectively.
Current usage metrics show cumulative count of Article Views (full-text article views including HTML views, PDF and ePub downloads, according to the available data) and Abstracts Views on Vision4Press platform.
Data correspond to usage on the plateform after 2015. The current usage metrics is available 48-96 hours after online publication and is updated daily on week days.
Initial download of the metrics may take a while.