Fig. 16
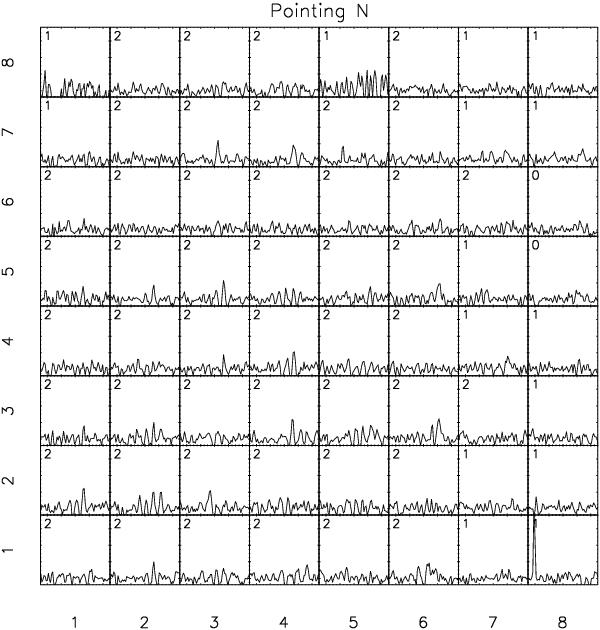
Spatial arrangement of the residuals after the fitting procedure of pointing S. The horizontal axis of all spectra ranges from 6650 Å to 6750 Å. The vertical axis scale is the same as in Fig. 4. The number at the top left corner of each panel indicates the number of components resulting from the fitting procedure. A spaxel labeled with “0” means that 0 components were assigned to this spaxel.
Current usage metrics show cumulative count of Article Views (full-text article views including HTML views, PDF and ePub downloads, according to the available data) and Abstracts Views on Vision4Press platform.
Data correspond to usage on the plateform after 2015. The current usage metrics is available 48-96 hours after online publication and is updated daily on week days.
Initial download of the metrics may take a while.