Fig. 1
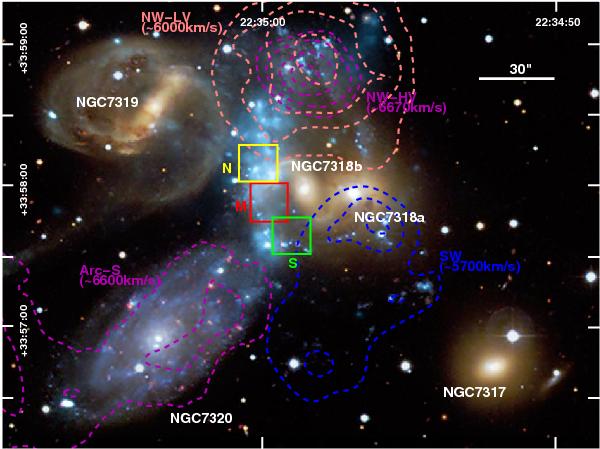
False-color image of SQ. The color-code is as follows: X-ray from Chandra (cyan), optical light (red, yellow, blue and white) from the CFHT. The image width is 6.3 arcmin. North is up. Overimposed we show our three PMAS pointings (yellow, red and green for the N, M and S pointings respectively). We also overlaid the Hi contours from Williams et al. (2002) and labeled the four main structures reported in that paper as well as their approximate recession velocities. The bar representing an angular distance of 30” corresponds to a linear scale of 12.89 kpc.
Current usage metrics show cumulative count of Article Views (full-text article views including HTML views, PDF and ePub downloads, according to the available data) and Abstracts Views on Vision4Press platform.
Data correspond to usage on the plateform after 2015. The current usage metrics is available 48-96 hours after online publication and is updated daily on week days.
Initial download of the metrics may take a while.