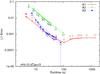
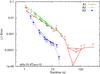
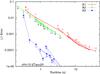
Fig. 7
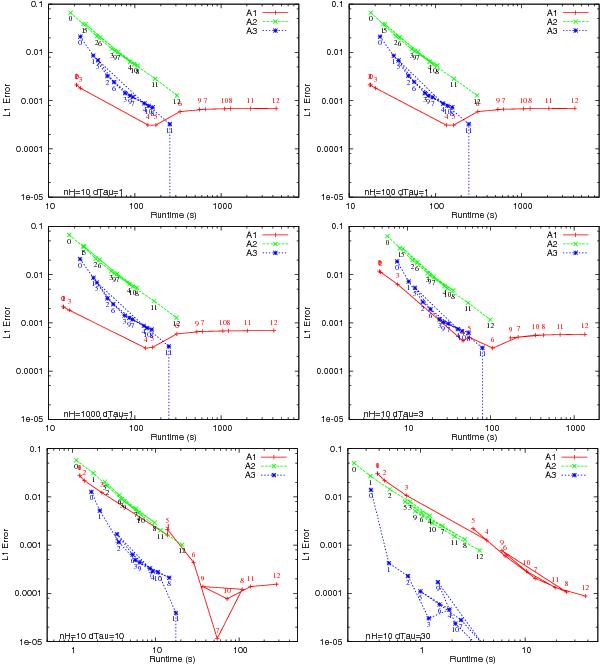
Accuracy as measured by the L1 error as a function of simulation runtime in seconds for the different algorithms and timestep criteria, for simulation outputs at t = trec. The first three panels show results for the simulations with cell Δτ0 ≃ 1 and ambient densities nH = 10 cm-3 (top left), 100 cm-3 (top right), and 1000 cm-3 (centre left). The next three show results for simulations with nH = 10 cm-3 and cell Δτ0 ≃ 3 (centre right), Δτ0 ≃ 10 (bottom left), and Δτ0 ≃ 30 (bottom right). Each point represents a timestep criterion with A1 in red, A2 in green, and A3 in blue. The points are numbered according to the timestep criteria (A1 in red, A2 in black, A3 in blue), although not all numbers are readable due to overcrowding.
Current usage metrics show cumulative count of Article Views (full-text article views including HTML views, PDF and ePub downloads, according to the available data) and Abstracts Views on Vision4Press platform.
Data correspond to usage on the plateform after 2015. The current usage metrics is available 48-96 hours after online publication and is updated daily on week days.
Initial download of the metrics may take a while.