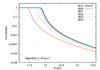
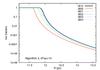
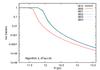
Fig. 6
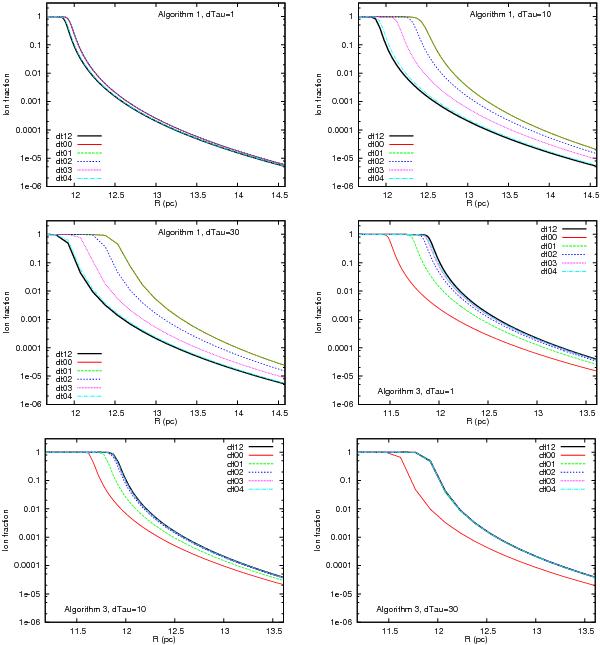
Plots of the radial profile of the H+ fraction at t = trec for A1 (first three plots) and A3 (last three plots). Results for nH = 10 cm-3 are shown (results for higher densities were indistinguishable) for A1 with cell optical depths Δτ0 ≃ 1 (top left), Δτ0 ≃ 10 (top right), and Δτ0 ≃ 30 (centre left), and the equivalent plots for A3 are centre right, bottom left, and bottom right. For A1 and A3 the criteria dt06-dt11 all provide good fits, very close to the dt12 results. As in previous figures, the discreteness of the grid is seen in the Δτ0 ≃ 30 plots.
Current usage metrics show cumulative count of Article Views (full-text article views including HTML views, PDF and ePub downloads, according to the available data) and Abstracts Views on Vision4Press platform.
Data correspond to usage on the plateform after 2015. The current usage metrics is available 48-96 hours after online publication and is updated daily on week days.
Initial download of the metrics may take a while.