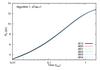
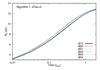
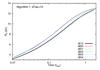
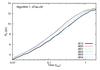
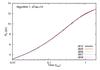
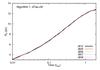
Fig. 4
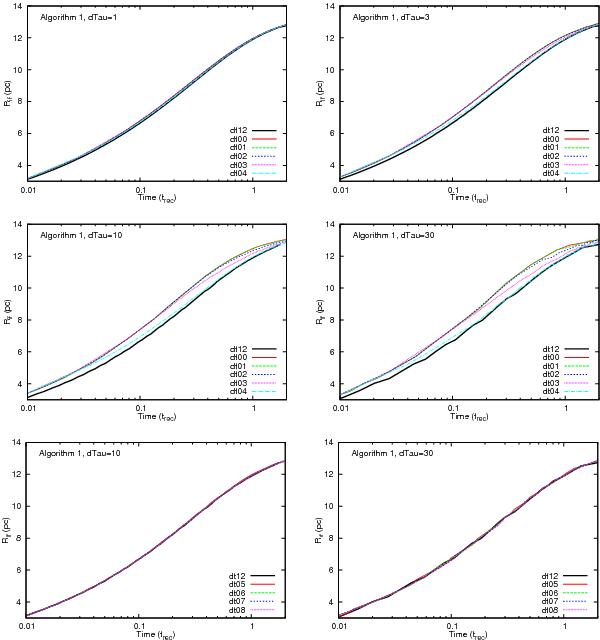
Expansion of a Strömgren sphere in 1D using A1 with an ambient gas density of nH = 10 cm-3 (results for higher densities are almost indistinguishable). The position of the cell with the steepest radial gradient in H+ fraction is plotted as a function of time for simulations with cell optical depth Δτ0 ≃ 1 and dt00-dt04 (top left), Δτ0 ≃ 3 and dt00-dt04 (top right), Δτ0 ≃ 10 and dt00-dt04 (centre left), Δτ0 ≃ 30 and dt00-dt04 (centre right), Δτ0 ≃ 10 and dt05-dt08 (below left), and Δτ0 ≃ 30 and dt05-dt08 (below right). The equivalent plots for dt09-dt12 all show results indistinguishable from the dt12 curve. The trend for decreasing accuracy with increasing cell optical depth (i.e. decreasing numerical resolution) for criteria dt00-dt04 is clearly seen in the first four panels; this is corrected by the criteria dt05-dt08 that also limit the timestep by the relative change in internal energy. Discreteness in the computational grid and the output frequency account for the non-smooth curves in the plots for Δτ0 ≃ 10 and 30 (also in the following figures).
Current usage metrics show cumulative count of Article Views (full-text article views including HTML views, PDF and ePub downloads, according to the available data) and Abstracts Views on Vision4Press platform.
Data correspond to usage on the plateform after 2015. The current usage metrics is available 48-96 hours after online publication and is updated daily on week days.
Initial download of the metrics may take a while.