Fig. 5
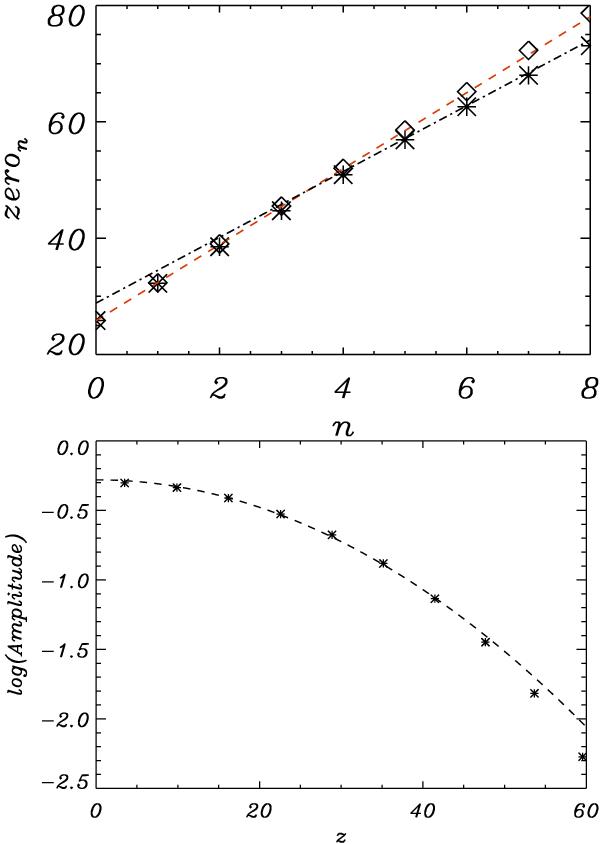
The top panel shows the location of the zeroes of vr (crosses) and bz (diamonds) for the oscillations in Fig. 4. The zeroes for bz have been shifted to be in phase with those for vr. The dashed (red) and dot-dashed (black) lines represent the predicted values for the kink mode and Alfvén mode, respectively. The bottom panel shows the natural logarithm of the amplitude of the vr signal as a function of height. The dashed line indicates Gaussian nature of the spatial damping profile.
Current usage metrics show cumulative count of Article Views (full-text article views including HTML views, PDF and ePub downloads, according to the available data) and Abstracts Views on Vision4Press platform.
Data correspond to usage on the plateform after 2015. The current usage metrics is available 48-96 hours after online publication and is updated daily on week days.
Initial download of the metrics may take a while.