Fig. 1
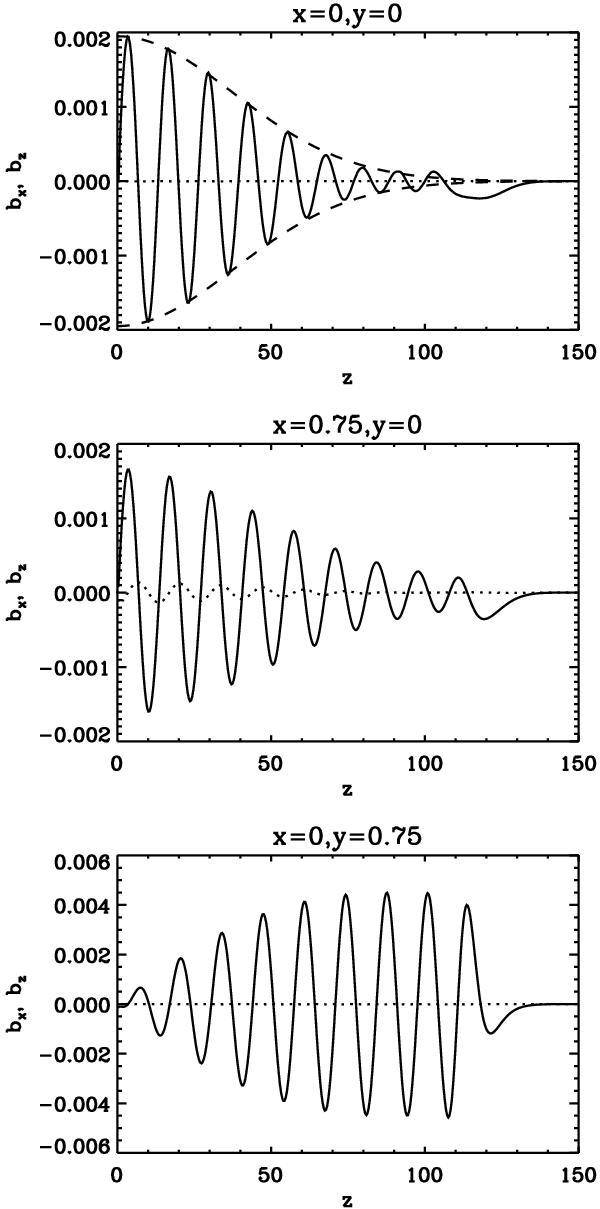
Magnetic field components as a function of height for a simulation driven with a single harmonic frequency. The solid lines and dotted lines represent bx and bz, respectively. The top panel shows the kink mode along the loop axis. The middle panel shows the kink mode inside the inhomogeneous layer. The bottom panel shows the Alfvén mode in the inhomogeneous layer. (Note that bz has nodes at the (x,y) locations in the top and bottom panels.)
Current usage metrics show cumulative count of Article Views (full-text article views including HTML views, PDF and ePub downloads, according to the available data) and Abstracts Views on Vision4Press platform.
Data correspond to usage on the plateform after 2015. The current usage metrics is available 48-96 hours after online publication and is updated daily on week days.
Initial download of the metrics may take a while.