Fig. 5
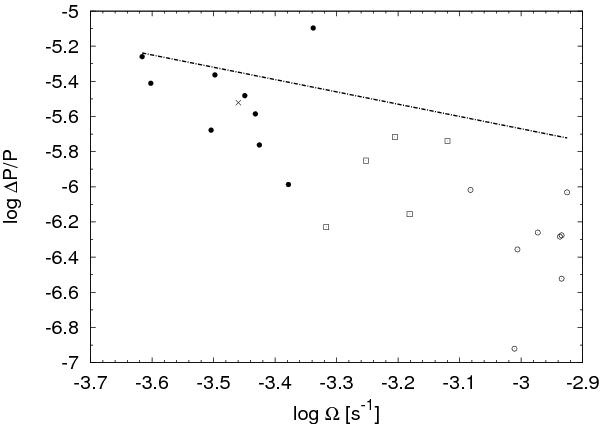
Diagram of the fractional period change ΔP/P versus the angular velocity Ω of the active component star for CVs according to Table 2. The position of EX Dra is indicated by a cross, the other long-period CVs, short-period CVs and pre-CVs in the period gap are denoted by dots, circles, and open squares, respectively. The best linear fit to data above the period gap derived by Borges et al. (2008) ΔP/P ∝ Ω-0.7 is indicated by the dot-dashed line.
Current usage metrics show cumulative count of Article Views (full-text article views including HTML views, PDF and ePub downloads, according to the available data) and Abstracts Views on Vision4Press platform.
Data correspond to usage on the plateform after 2015. The current usage metrics is available 48-96 hours after online publication and is updated daily on week days.
Initial download of the metrics may take a while.