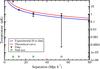
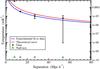
Fig. 3

Top graph illustrates the cross-correlation function while the bottom one depicts the auto-correlation function. Both the theoretical curves and the experimental cures follow a power law ξ(r) = A(r/r0) − γ. The error bars are 2σ bootstrap errors generated using 500 randomizations. The values provided at 8 Mpc h-1 are only upper bounds.
Current usage metrics show cumulative count of Article Views (full-text article views including HTML views, PDF and ePub downloads, according to the available data) and Abstracts Views on Vision4Press platform.
Data correspond to usage on the plateform after 2015. The current usage metrics is available 48-96 hours after online publication and is updated daily on week days.
Initial download of the metrics may take a while.