Fig. 6
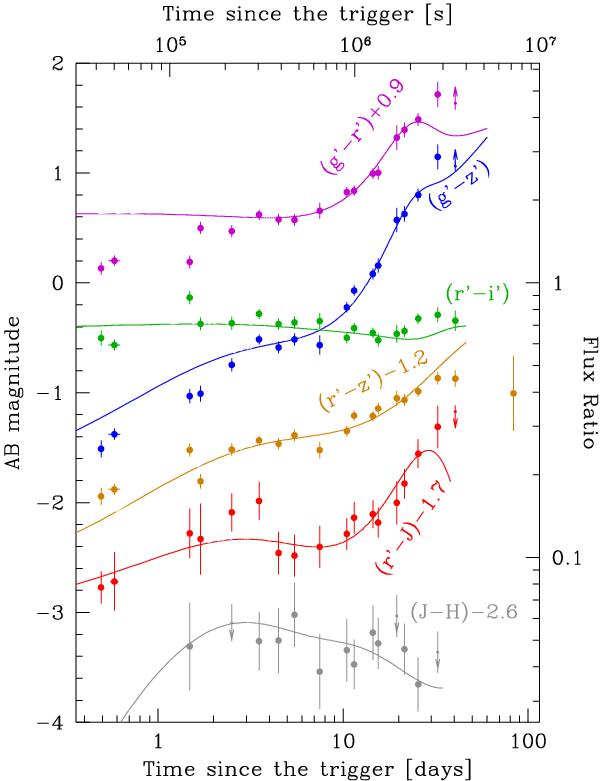
Colour curves corrected for host-galaxy extinction and afterglow-subtracted. Filled circles represent detections in both filters and arrows are upper limits derived from detections in one of the two bands. Solid lines represent the colour evolution of SN 1998bw derived from the light-curve fits in Sect. 4.3. For clarity, error bars do not include the systematic error in AV,host and for the last epoch, upper limits are not shown.
Current usage metrics show cumulative count of Article Views (full-text article views including HTML views, PDF and ePub downloads, according to the available data) and Abstracts Views on Vision4Press platform.
Data correspond to usage on the plateform after 2015. The current usage metrics is available 48-96 hours after online publication and is updated daily on week days.
Initial download of the metrics may take a while.