Fig. 4
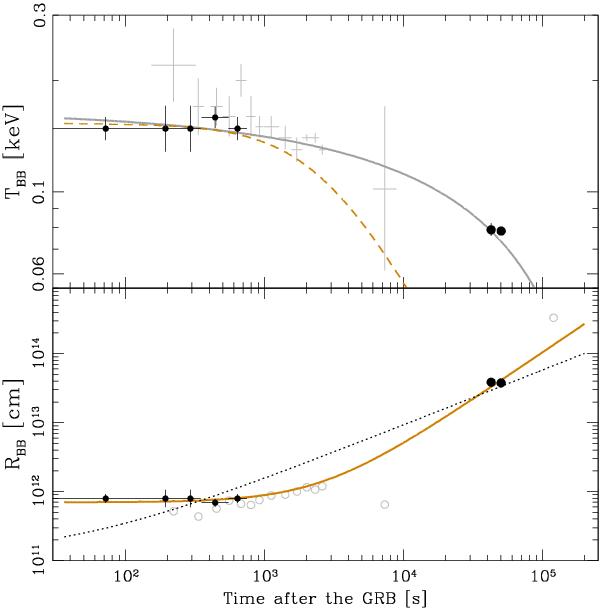
Temperature and radius evolution of the blackbody component. Black data points are those derived using combined BAT+XRT data (Starling et al. 2011) plus the temperature determinations using GROND data ( ≈ 46 ks). The first data bin from Starling et al. (2011) represents the interval from − 175 to 144 s, however, due to fitting and plotting purposes, here it corresponds to 0–144 s. Solid, dashed and dotted lines are different power-law models (see main text). Best fits to temperature and radius are shown in grey and brown solid lines, respectively. Grey crosses (upper panel) and open circles (lower panel) are measurements of XRF 060218/SN 2006aj taken from Kaneko et al. (2007) and Campana et al. (2006), respectively.
Current usage metrics show cumulative count of Article Views (full-text article views including HTML views, PDF and ePub downloads, according to the available data) and Abstracts Views on Vision4Press platform.
Data correspond to usage on the plateform after 2015. The current usage metrics is available 48-96 hours after online publication and is updated daily on week days.
Initial download of the metrics may take a while.