Free Access
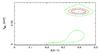
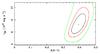
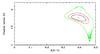
Fig. 3
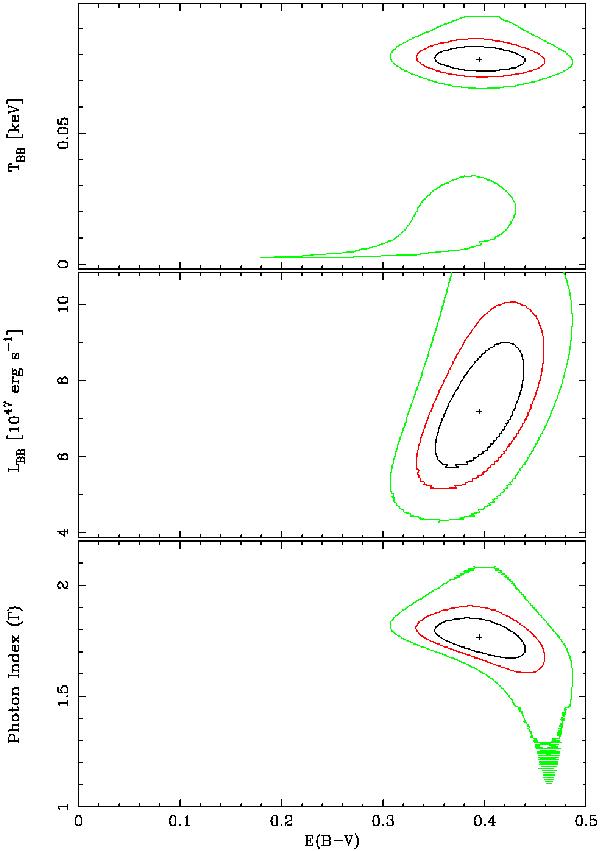
Contour plots for the best-fit parameters from the modelling of the second epoch. From the outer- to the innermost contours, the green, red, and black lines are 3, 2, and 1σ contours, respectively. The tail at low Γ in the bottom panel is caused by numerical inaccuracies.
This figure is made of several images, please see below:
Current usage metrics show cumulative count of Article Views (full-text article views including HTML views, PDF and ePub downloads, according to the available data) and Abstracts Views on Vision4Press platform.
Data correspond to usage on the plateform after 2015. The current usage metrics is available 48-96 hours after online publication and is updated daily on week days.
Initial download of the metrics may take a while.