Fig. 2
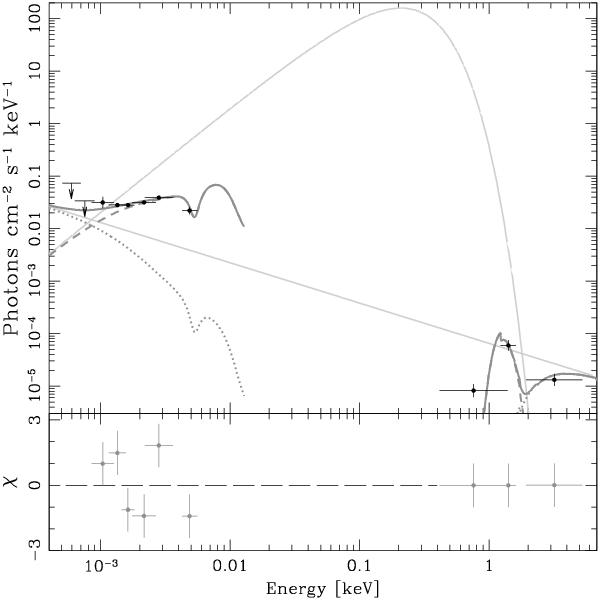
Broad-band SED at 50 ks after trigger. The observed data are represented by black filled circles. The HKs bands provide only 3σ upper limits shown as arrows. The thick grey line shows the best-fit model able to reproduce the data: extinguished power law plus blackbody components, which are shown individually with dotted and dashed grey lines, respectively. The thin continuous grey lines show the unextinguished versions of the power law corresponding to the afterglow and the thermal component. In the lower panel, the residuals of the best fit are plotted.
Current usage metrics show cumulative count of Article Views (full-text article views including HTML views, PDF and ePub downloads, according to the available data) and Abstracts Views on Vision4Press platform.
Data correspond to usage on the plateform after 2015. The current usage metrics is available 48-96 hours after online publication and is updated daily on week days.
Initial download of the metrics may take a while.