Fig. 4
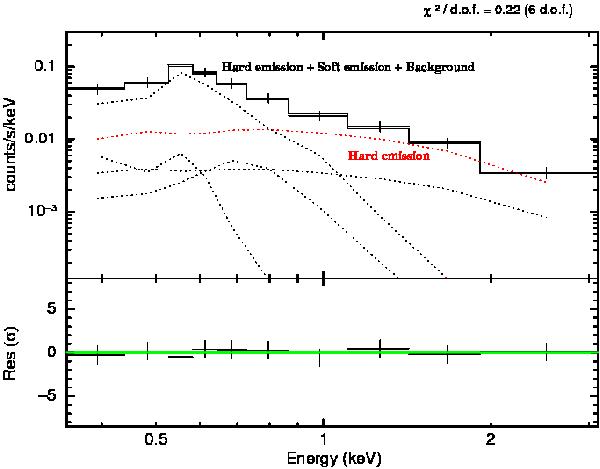
XMM-Newton EPIC-pn spectrum of the hard emitting region with a power-law model fit. The solid line is for the hard emission plus background spectra. Here, the background is the sum of the shell emission and the local emission. The background spectrum and shell spectrum were evaluated as described in Sect. 3.2.4. The background spectrum was not subtracted from the source spectrum but was modelled simultaneously and is included in the spectral model of the source spectrum. The contribution from the hard emitting region is represented in red. The bottom panel shows the residuals from the best-fit model.
Current usage metrics show cumulative count of Article Views (full-text article views including HTML views, PDF and ePub downloads, according to the available data) and Abstracts Views on Vision4Press platform.
Data correspond to usage on the plateform after 2015. The current usage metrics is available 48-96 hours after online publication and is updated daily on week days.
Initial download of the metrics may take a while.