Fig. 1
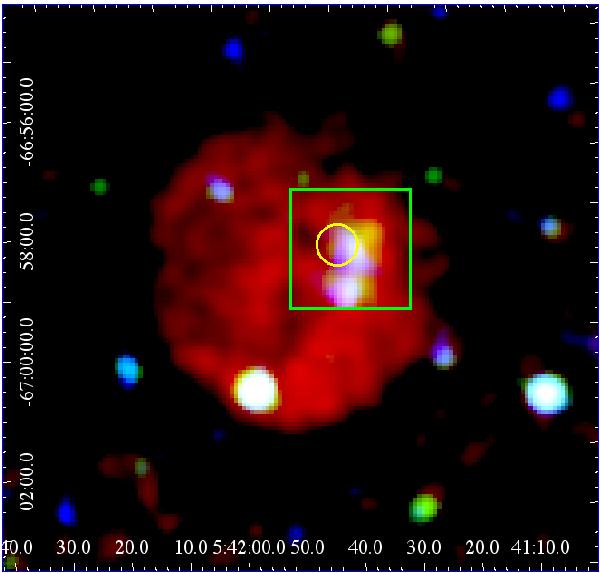
Smoothed RGB three-colour image of combined exposure-corrected XMM-Newton EPIC pn, MOS1 and MOS2 data (red: 0.2–1.0 keV; green: 1.0–2.0 keV; blue: 2.0–4.5 keV, square root scale). The instrumental background was estimated using the method described in Sect. 3.2.1 and subtracted from the images. The renormalisation factor was derived from the shaded detector corners. The field of the radio image presented in Fig. 5 is overlaid for comparison (green square). The position of the ROSAT source [HP99] 456 is represented by a yellow circle.
Current usage metrics show cumulative count of Article Views (full-text article views including HTML views, PDF and ePub downloads, according to the available data) and Abstracts Views on Vision4Press platform.
Data correspond to usage on the plateform after 2015. The current usage metrics is available 48-96 hours after online publication and is updated daily on week days.
Initial download of the metrics may take a while.