Fig. 4
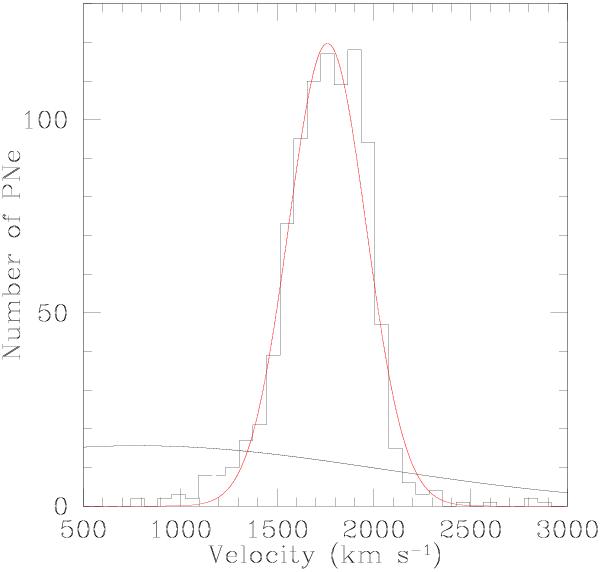
Velocity histogram of the PNe detected in the NGC 1316 observations. This includes objects associated with NGC 1316 and NGC 1317. The red Gaussian represents NGC 1316 and the black curve indicates the transmission of the filter in the relevant velocity range. Some low-velocity objects are skewing the distribution, and we see the suggestion of a second peak near the systemic velocity of NGC 1317. (1941 km s-1 according to de Vaucouleurs et al. 1991).
Current usage metrics show cumulative count of Article Views (full-text article views including HTML views, PDF and ePub downloads, according to the available data) and Abstracts Views on Vision4Press platform.
Data correspond to usage on the plateform after 2015. The current usage metrics is available 48-96 hours after online publication and is updated daily on week days.
Initial download of the metrics may take a while.