Free Access
Fig. 3
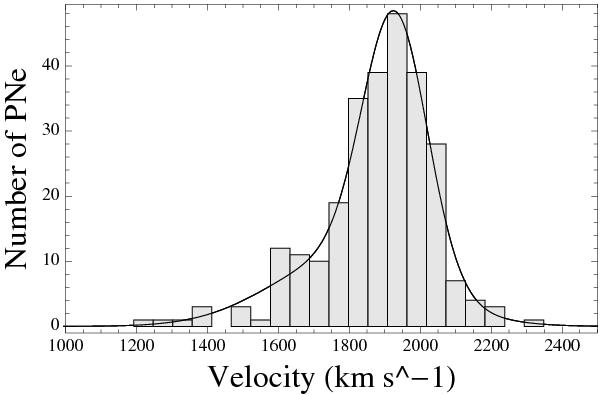
Velocity distribution and histogram of the PNe from the F7 observations. The velocities are represented in the histogram. The smooth function represents the maximum-likelihood fit to the distribution – it is parametrized as the sum of two Gaussians multiplied by a Gaussian representing the filter.
Current usage metrics show cumulative count of Article Views (full-text article views including HTML views, PDF and ePub downloads, according to the available data) and Abstracts Views on Vision4Press platform.
Data correspond to usage on the plateform after 2015. The current usage metrics is available 48-96 hours after online publication and is updated daily on week days.
Initial download of the metrics may take a while.