Fig. 7
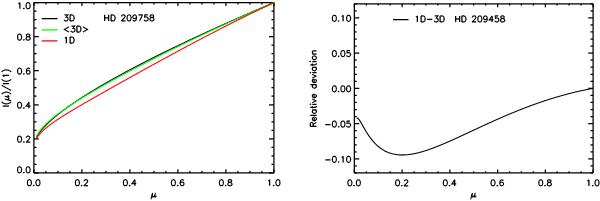
Left: wavelength-integrated limb darkening curves for the 3D model of HD 209458 (black solid line), the mean 3D model (green solid line) and the 1D MARCS model (red solid line). Surface intensities between 2900 Å and 5700 Å were weighted with the sensitivity function of the HST STIS instrument and wavelength (see Appendix A). Right: relative deviation between the limb darkening predictions of the 1D MARCS model with respect to the 3D model.
Current usage metrics show cumulative count of Article Views (full-text article views including HTML views, PDF and ePub downloads, according to the available data) and Abstracts Views on Vision4Press platform.
Data correspond to usage on the plateform after 2015. The current usage metrics is available 48-96 hours after online publication and is updated daily on week days.
Initial download of the metrics may take a while.