Fig. 5
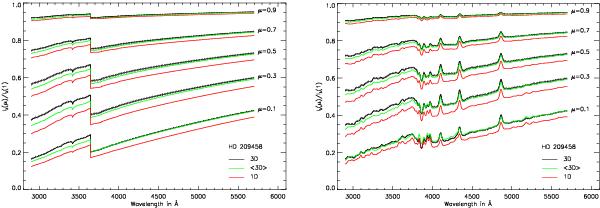
Surface intensities Iλ(μ)/Iλ(1) for HD 209458 at different μ angles, including only continuous absorption (left panel) as well as continuous and spectral line absorption (right panel) in the radiative transfer computation. Time-averaged 3D spectra (black solid lines) are compared to spectra derived from the mean 3D model (green solid lines) and the 1D MARCS model (red solid lines). Dotted black lines show spectra derived from 3D snapshots that exhibit intensity minima and maxima at 5700 Å, bracketing the time variation of the 3D surface brightness due to oscillations in the model atmosphere. Note that spectra in the right panel were convolved with a Gaussian kernel with λ/Δλ = 250 for clarity.
Current usage metrics show cumulative count of Article Views (full-text article views including HTML views, PDF and ePub downloads, according to the available data) and Abstracts Views on Vision4Press platform.
Data correspond to usage on the plateform after 2015. The current usage metrics is available 48-96 hours after online publication and is updated daily on week days.
Initial download of the metrics may take a while.