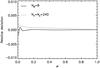
Fig. 2

Left: theoretical average surface brightness distribution as a function of projection factor μ integrated over the spectrum between 3400 Å and 3500 Å, computed using our “standard” numerical resolution for an arbitrary snapshot of the 3D model of HD 189733 (crosses), and least-squares fits of the Claret (2000) nonlinear law (solid line) and a linear law (dotted line). The gray-shaded area indicates the central part of the stellar disk that is not reached during the transit. Right: relative deviation of spline interpolations of theoretical limb darkening computed with Nφ = 8 direction angles (solid line) and with the full horizontal resolution of Nx = Ny = 240 grid points (dotted line) from the interpolated “standard” setting.

Current usage metrics show cumulative count of Article Views (full-text article views including HTML views, PDF and ePub downloads, according to the available data) and Abstracts Views on Vision4Press platform.
Data correspond to usage on the plateform after 2015. The current usage metrics is available 48-96 hours after online publication and is updated daily on week days.
Initial download of the metrics may take a while.