Fig. 1
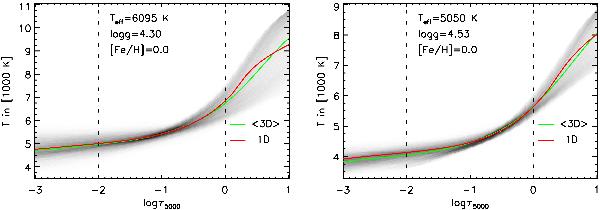
Temperature distributions (gray shades) on surfaces with constant optical depth at 5000 Å for arbitrary snapshots of the 3D models for HD 209458 (left) and HD 189733 (right). The spatial and temporal mean temperature stratification of the 3D models (green solid lines) is compared to 1D MARCS models (red solid lines) with the same stellar parameters. The dashed lines bracket the approximate height region between log τ5000 = 0 and log τ5000 = −2, from which the dominant contribution to the continuum surface brightness between the disk center at μ = 1.0 and the limb near μ = 0.01 is emitted.
Current usage metrics show cumulative count of Article Views (full-text article views including HTML views, PDF and ePub downloads, according to the available data) and Abstracts Views on Vision4Press platform.
Data correspond to usage on the plateform after 2015. The current usage metrics is available 48-96 hours after online publication and is updated daily on week days.
Initial download of the metrics may take a while.