Fig. 7
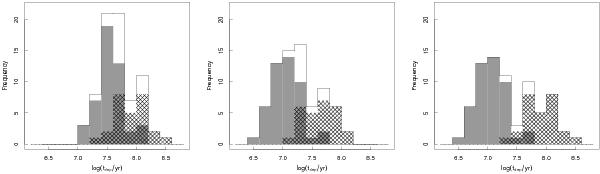
Histograms of depletion times for the dense gas in the whole sample of galaxies (solid line) and in the populations of LIRGs/ULIRGs (gray filled) and of normal galaxies (hatched). The depletion times in the left-hand panel are calculated assuming the same FIR-to-SFR and HCN-to-mass conversion factors for the two populations. In the middle panel, the two conversion factors are modified (see Sect. 6), whereas in the right-hand panel only the HCN-to-mass factor is changed.
Current usage metrics show cumulative count of Article Views (full-text article views including HTML views, PDF and ePub downloads, according to the available data) and Abstracts Views on Vision4Press platform.
Data correspond to usage on the plateform after 2015. The current usage metrics is available 48-96 hours after online publication and is updated daily on week days.
Initial download of the metrics may take a while.