Fig. 3
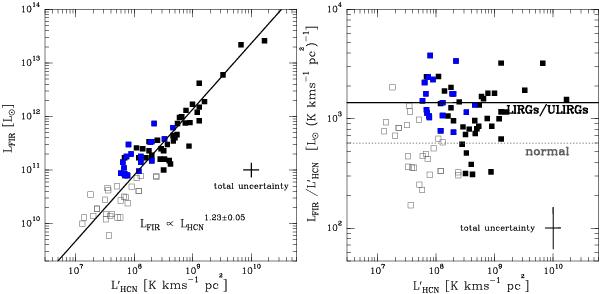
a) (Left panel) LFIR- correlation plot derived for different galaxy samples. The solid line visualizes the orthogonal regression fit to the full sample, showing a superlinear correlation. The errorbars show the total uncertainty of individual data points (±0.13 dex = ±30% in both LFIR and
  ). b) (Right panel) We plot the
  luminosity ratio as a function of . We display with different symbols normal galaxies (LIR < 1011 L⊙, open squares) and luminous infrared galaxies (LIR > 1011 L⊙, filled squares). The location of the new sample of LIRGs in this diagram is identified by blue color markers. The dashed and continuous horizontal lines indicate the average value of in normal galaxies (~600 ± 70 L⊙ L′-1) and LIRGs/ ULIRGs (~1400 ± 100 L⊙ L′-1). The errorbars show the total uncertainty of individual data points: ±0.13 dex(±30%) in and ± 0.19 dex( ± 42%) in .
Current usage metrics show cumulative count of Article Views (full-text article views including HTML views, PDF and ePub downloads, according to the available data) and Abstracts Views on Vision4Press platform.
Data correspond to usage on the plateform after 2015. The current usage metrics is available 48-96 hours after online publication and is updated daily on week days.
Initial download of the metrics may take a while.