Fig. 2
a) (Left panel) We plot the  luminosity ratio, a proxy for the SFEdense defined in Sect. 2, as a function of LFIR for different galaxy samples compiled in this work (see Sect. 2 for details). The different symbols represent the normal galaxies and LIRGs/ ULIRGs published by Gao & Solomon (2004a,b; crosses), the LIRGs/ULIRGs published by Graciá-Carpio et al. (2008, empty circles), Palomar Green (PG) QSOs and high-z galaxies published and compiled by Evans et al. (2006) and Gao et al. (2007), respectively (triangles), and the new sample of LIRGs published in this work (filled circles). Arrows represent upper and lower limits to
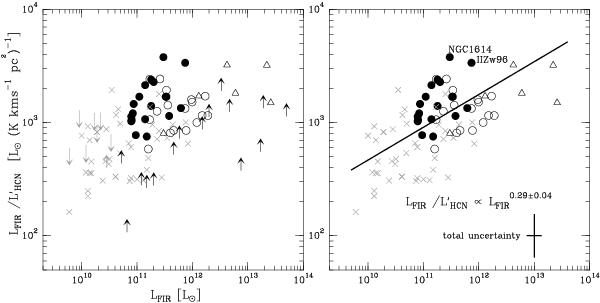
  . b) (Right panel) Same as a), but limits are not represented. The solid line visualizes the orthogonal regression fit calculated for the full sample of objects, excluding limits. We highlight the location of NGC 1614 and II Zw96 in this plot. The total uncertainty of individual data points, including statistical and estimated systematic errors, are indicated by error bars: ±0.13 dex(±30%) in LFIR and ±0.19 dex(±42%) in .
Current usage metrics show cumulative count of Article Views (full-text article views including HTML views, PDF and ePub downloads, according to the available data) and Abstracts Views on Vision4Press platform.
Data correspond to usage on the plateform after 2015. The current usage metrics is available 48-96 hours after online publication and is updated daily on week days.
Initial download of the metrics may take a while.