Fig. 14
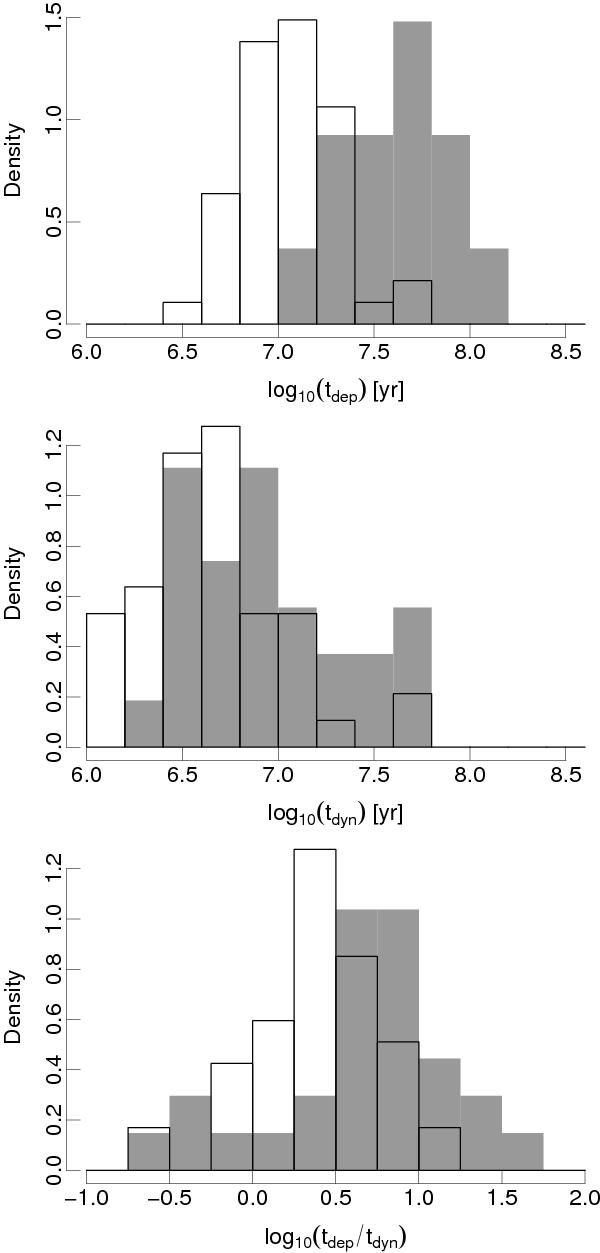
a) (Upper panel) Histograms showing the number density of galaxies (number of galaxies per unit interval, as shown) as a function of log(tdep) for normal galaxies (LIR < 1011 L⊙, gray filled histogram) and luminous infrared galaxies (LIR > 1011 L⊙, empty histogram). b) (Middle panel) Same as a) but representing the number density of galaxies as a function of log (tdyn). c) (Lower panel) Same as a) but representing the number density of galaxies as a function of log (tdep/tdyn).
Current usage metrics show cumulative count of Article Views (full-text article views including HTML views, PDF and ePub downloads, according to the available data) and Abstracts Views on Vision4Press platform.
Data correspond to usage on the plateform after 2015. The current usage metrics is available 48-96 hours after online publication and is updated daily on week days.
Initial download of the metrics may take a while.