Fig. 10
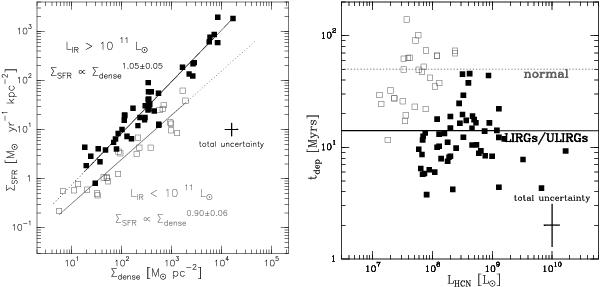
a) (Left panel) Same as Fig. 6a, but showing the revised two-function power law fit to normal galaxies (gray line) and luminous infrared galaxies (black line) discussed in Sect. 6.3. Symbols and errorbars as in Fig. 6. b) (Right panel) We show the revised depletion time scale as a function of  derived in normal and luminous infrared galaxies, as discussed in Sect. 6.3. The dashed and continuous horizontal lines indicate the average value of the depletion time scale in normal galaxies (tdep ~ 50 ± 5 Myr) and LIRGs/ULIRGs (tdep ~ 14 ± 1.4 Myr). Symbols and errorbars as in Fig. 5.
Current usage metrics show cumulative count of Article Views (full-text article views including HTML views, PDF and ePub downloads, according to the available data) and Abstracts Views on Vision4Press platform.
Data correspond to usage on the plateform after 2015. The current usage metrics is available 48-96 hours after online publication and is updated daily on week days.
Initial download of the metrics may take a while.